Scientometrics
Scientometrics – scientometric indicators
Scientometrics measures and analyses the activity of researchers, scientific institutions and scientific publications using quantitative methods. It aims to characterise scientific performance with objective indicators that show the importance and impact of a researcher or group of researchers on the scientific community.
These metrics are often used to measure and rank research results, identify research strengths, and shape concepts of future research strategies.
Metrics are available at three levels:
Journal-level metrics
Journal-level metrics are used to evaluate scientific journals. They aim to reflect the position and influence of a journal in a given subject field. Below, we will introduce the metrics according to the databases used as sources. It’s important to note that the two major bibliographical databases that index journals (Web of Science and Scopus) use two different systems of classification when categorizing journals according to their fields.
Web-of-Science based metrics
Impact factor
The impact factor (IF or JIF) indicates the impact of a journal. JIF value is only assigned to journals recorded in the Web of Science database. Official JIF values are available in the Journal Citation Reports (JCR) on the WoS interface. The subscription-based database can be accessed on Corvinus University of Budapest premises or remotely via VPN.
The impact factor in the current year is the average number of citations received by the articles published in the previous two years.
Calculation method: in the current year, the number of citations to articles from the previous two years is divided by the number of (citable) articles from the previous two years. Its value strongly depends on the subject field, so it is worth using it for comparing journals within the same field.
Journals with a JIF value are divided into thematic groups in the given year. The thematic lists are arranged by JIF, and accordingly, quartiles are formed – these are not to be mixed with Scimago’s Q1-Q4 classification.
JIF values are not visible in MTMT, but in its public Journal search interface is a good way to check whether a journal has impact factor.
Eigenfactor metrics
Eigenfactor ranks journals according to their influence. It measures the citation rate of a journal, but it differentiates between citations of high and low prestige journals. It shows how often the articles of a given journal in a given year have been cited in the past five years.
Self-citations are not included in calculation.
Eigenfactor metrics include Eigenfactor Score, which indicates the journal’s importance to the scientific community, and the Article Influence Score, which measures the average influence of a journal.
EF and AI metrics are available in the JCR database from 2016.
Scopus-based metrics
SCImago Journal Rank (SJR)
SCImago Journal & Country Rank (SJR) is a freely available portal that – based on Scopus database – provides scientific indicators and rankings for journals and countries.
SJR indicates the average value of citations for a given year. It is calculated by dividing the average number of the weighted citations received in a given year by the number of documents published in the previous three years.
Based on the SJR indicator, journals are arranged in descending order according to subject fields, and four quartiles are defined: Q1, Q2, Q3, and Q4.
The top 25% of the journals belong to the Q1 quartile, whose first 10 % is rated D1 in MTMT.
MTMT imports the Q1-Q4 values from Scimago, assigns them to the journals and makes them publicly available.
Data are updated once a year (in summer).
CiteScore
It is a metric showing the citation data of publications indexed by Scopus. CiteScore is applied not only to journals but also to any serial publications.
It is calculated in the following way: the number of citations to documents in the current and the previous three years is divided by the number of documents published in the current and the previous three years.
Source-Normalized Impact per Paper (SNIP)
It measures contextual citation impact by weighting citations, based on all citations of the subject field. It aims to compare sources in different fields.
Based on Scopus, the three years’ data are counted anually.
For your further information:
MTA (Hungarian Academy of Sciences) journal lists
In certain fields it is quite common to publish in Hungarian as well as in high standard international journals not indexed in WoS and Scopus.
For this reason the sections and committees of the Hungarian Academy of Sciences (MTA) classify the journals of their subject fields into four categories: A, B, C, D.
These classifications are visible at the records in the MTMT database next to the international journal ranks. The MTA journal lists are available on the pages where the regulations on the doctoral procedures of different scientific committees can be found, and on the public interface of the MTMT database, broken down by sections.
For information about the journals (peer-review status, SJR indicators, MTA evaluations, etc.), see the Journal search in MTMT page.
***
Author-level metrics
Author-level metrics measure the impact of the authors’ scientific performance based on the number of their publications and their citations.
Indicators such as H-index, number of citations, etc., can be accessed in the authors’ profiles of different databases and portals (WoS, Scopus, ORCID, Google Scholar).
For further information about these profiles click on the Researcher identifiers page.
Hirsch-index
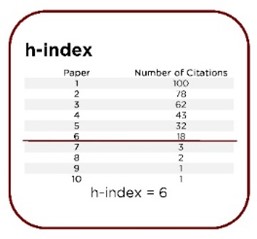
The h-index measures the authors’ impact based on the rate of citations received by their publications. The h-index is the h number of those publications of an author that have received at least h citations.
To calculate the h-index we list the publications with the one in the first place that has received the most citations, and the list should continue in a decreasing order. The h-index is the serial number of the publication that has at least as many citations as the serial number.
In MTMT, authors find their h-index in their Summary table.
In the non-public interface of the MTMT it is possible to query the h-index order after logging in the database and using the Hirsch-index template (clicking on the New search button in Searches and templates block).
Dissertations and publications categorized as Character not classified are not included in the Hirsch index.
Self-citations, however, are taken into consideration.
The h-index is different in each database. Databases always take into account the publications and citations they index.
i10 index
i10 index is an indicator used by Google Scholar that shows the number of those publications of an author that have at least 10 citations.
In MTMT, when calculating an author’s i10 index only those scientific publications are considered where the author is marked as author, source edition author or author of critical edition. Dissertations and publications categorized as Character not classified are not included.
***
Publication-level metrics
Field-weighted Citation Impact (FWCI)
This is a weighted citation metric introduced by Scopus. It shows how the number of a document’s citations is related to the expected average number of citations of all the other, similar documents in the given subject field.
If the FWCI value is 1 (FWCI=1), the number of citations is average.
If the value is greater than 1 (FWCI > 1), it means that the document has been cited more than the average of the subject field.
Category Normalized Citation Impact (CNCI).
The metric related to the Web of Science database measures category normalized citation impact. It is calculated in the following way: the actual number of the cited publications is divided by the expected citation rate for publications of the same type, same subject field, and year of publication. If the CNCI value is more than 1 (CNCI > 1), it means citation rate above the average.
***